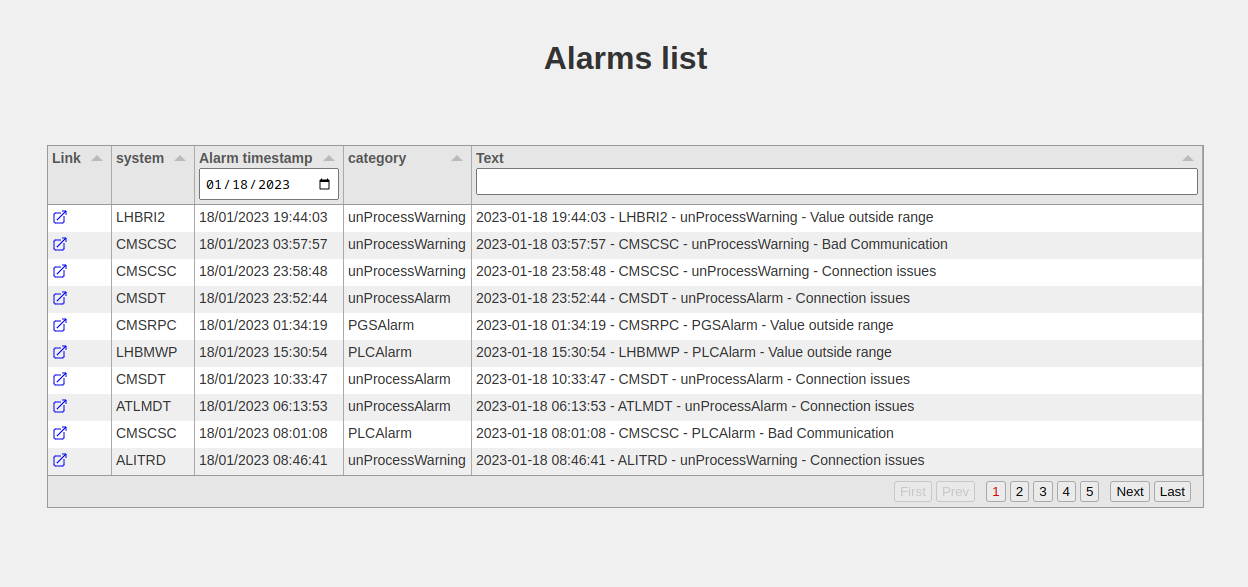
Display data from a SQL source on the web with Tabulator and FastAPI
With server side pagination and filtering
python
web
fastapi
tabulator
SQL
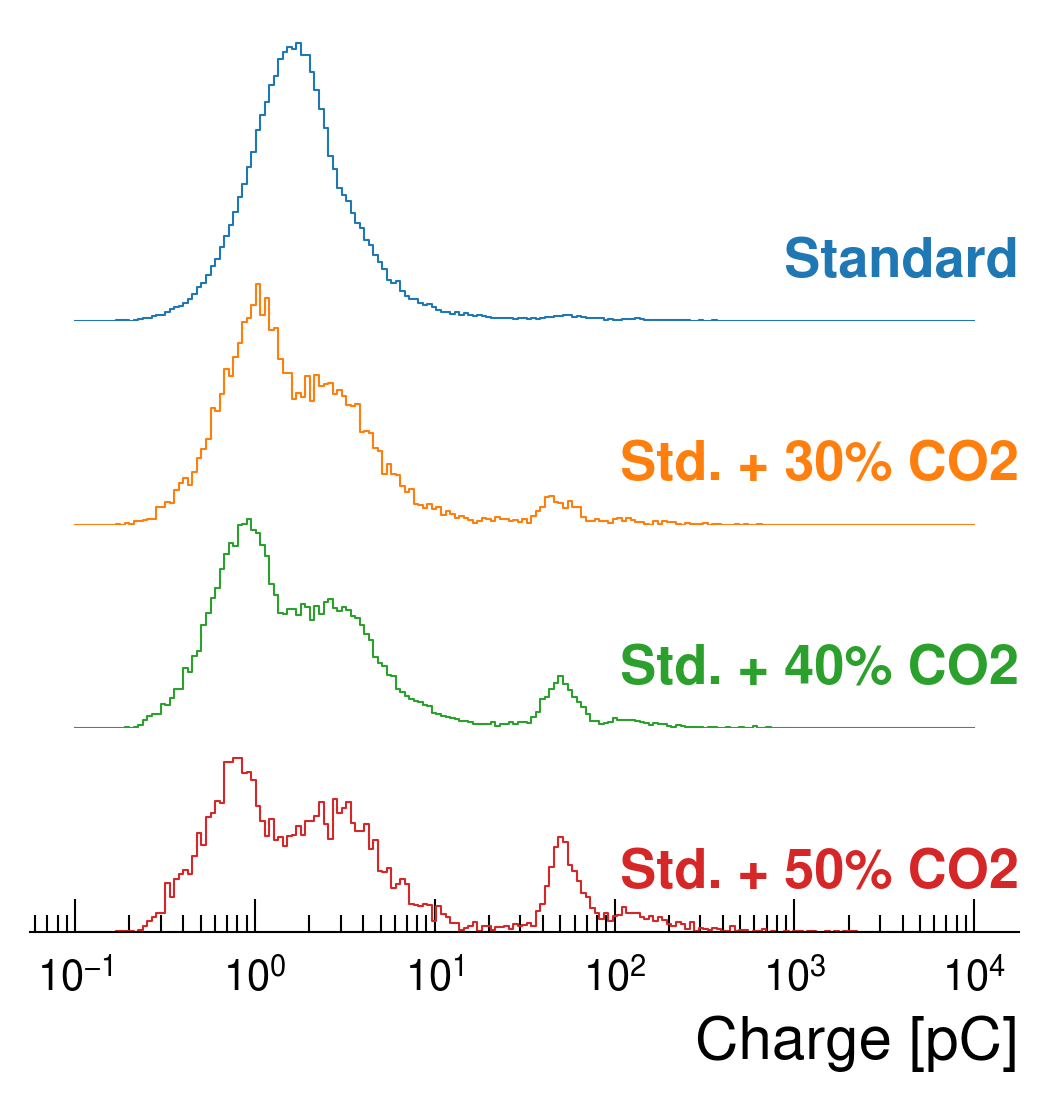
My take on overlapping densities (a.k.a. ridge) plots
A consistent style to produce distribution plots ready for publications.
python
matplotlib
plot
visualization
ridge-plot
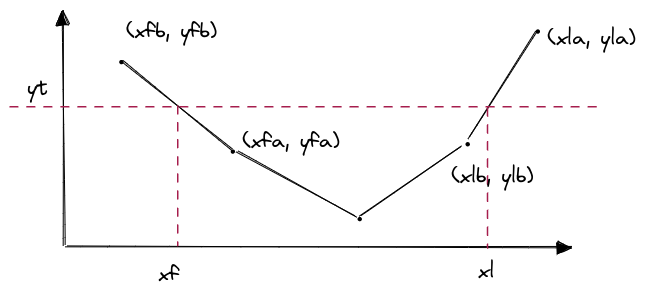
Time Over Threshold in signal processing
A useful indicator of your signal dynamics
python
matplotlib
scipy
numpy
signal processing
signal analysis
My matplotlib stylesheet
Sometimes you need to make your matplotlib plots look like they were generated by other libraries
python
matplotlib
plot
visualization
style

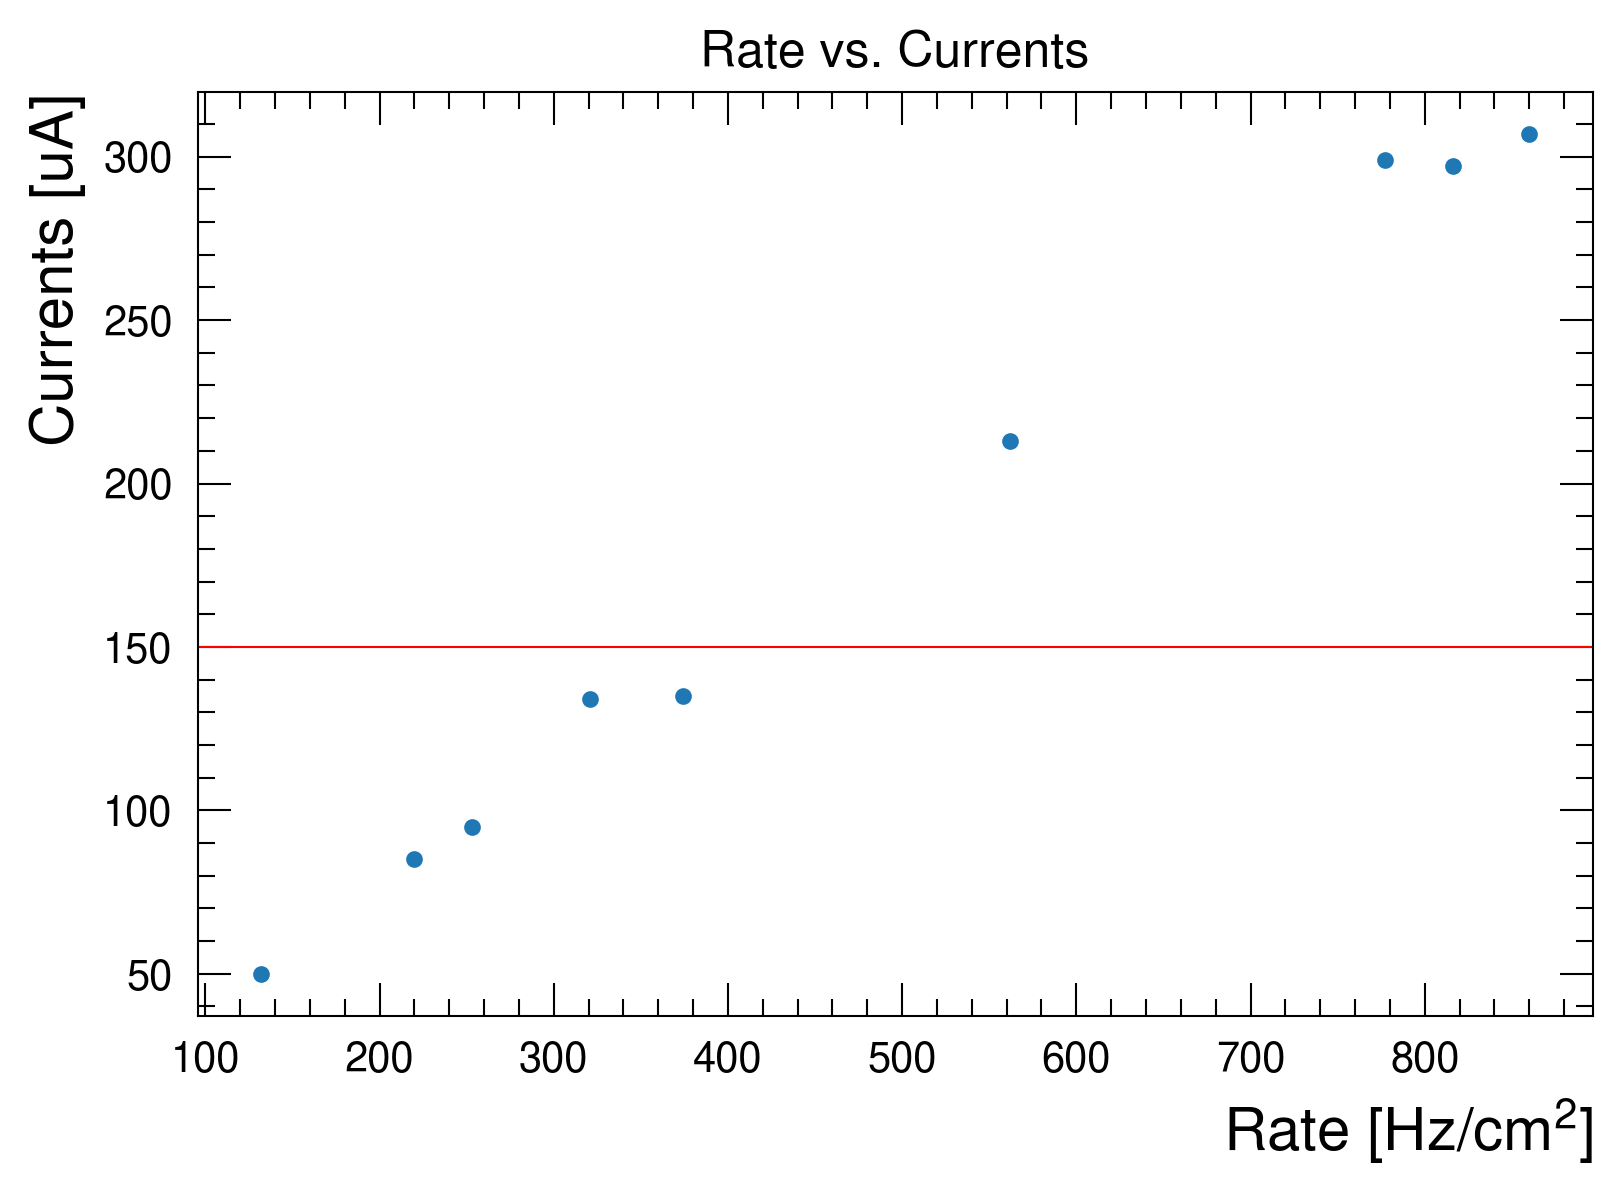
Multiple Y axes with matplotlib
Because sometimes right y axes are not enough
python
matplotlib
plot
visualization
A post made from a jupyter notebook
Or how I fell in love with Quarto
jupyter
notebook
python
quarto
No matching items